CGKY News Hub
Your go-to source for the latest insights and trends.
Seeing is Believing: Transforming Data into Compelling Visuals
Unlock the power of data! Discover how stunning visuals can transform insights into impactful stories that captivate and engage.
The Power of Data Visualization: How to Make Your Data Speak
The power of data visualization lies in its ability to transform complex datasets into easily digestible visual formats. By representing data visually, organizations can unveil patterns, trends, and insights that might remain hidden in raw numbers. For instance, utilizing graphs and charts allows viewers to grasp intricate relationships at a glance. The effective use of color, size, and shape can further enhance understanding, making it crucial to choose the right visualization method based on the data's context and audience. Some common types include:
- Bar charts
- Line graphs
- Pie charts
- Heat maps
Moreover, integrating data visualization into your reports and presentations can significantly enhance storytelling. Visuals not only captivate your audience but also aid in retaining information better than text-heavy documents. The key to making your data speak lies in your ability to simplify information while highlighting critical findings. Remember, the goal is to present data in a way that invites interpretation and discussion, rather than overwhelming viewers with numbers. As you refine your skills in data visualization, your ability to communicate insights will become increasingly powerful.

Top Tools for Creating Eye-Catching Data Visuals
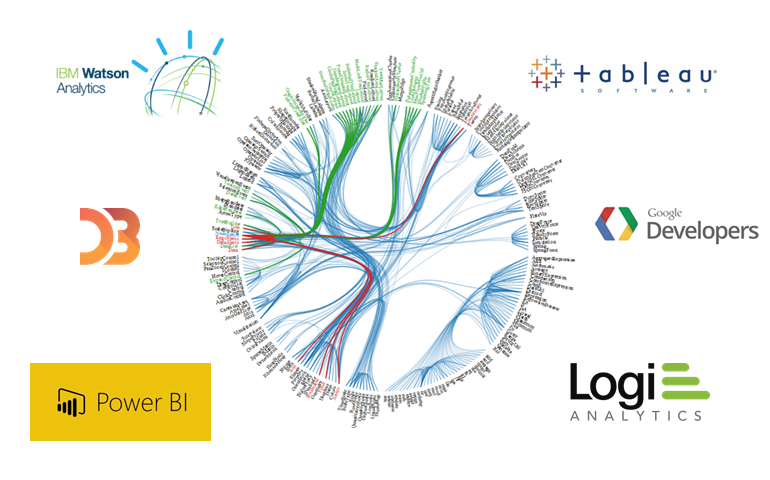
In the age of information, creating eye-catching data visuals is more crucial than ever. Effective data visualization helps simplify complex data sets and makes your content more engaging. Here are some of the top tools available to help you bring your data to life:
- Tableau: Renowned for its powerful business intelligence capabilities, Tableau allows users to create interactive and shareable dashboards.
- Canva: Ideal for non-designers, Canva offers numerous templates and intuitive editing features to craft stunning infographics.
Choosing the right tool can greatly enhance your data visuals and captivate your audience. Infogram is perfect for those looking to create animated infographics, while Microsoft Power BI provides robust analytics features tailored for enterprises. No matter which tool you select, remember that a good visual should not only be attractive but also tell a compelling story with your data.
Why Visualizing Data is Essential for Effective Decision Making
In today's data-driven world, the ability to visualize data has become essential for effective decision making. By transforming complex datasets into clear, understandable visuals, organizations can uncover trends and insights that might be overlooked in raw data form. Data visualization not only facilitates better comprehension of the information but also enables decision-makers to communicate their findings convincingly to stakeholders. Images, charts, and graphs can relay important metrics quickly, making it easier for teams to identify patterns and make informed choices.
Moreover, visualizing data plays a critical role in presenting information succinctly, which is particularly vital in high-stakes environments. When time is of the essence, being able to grasp the implications of data at a glance can lead to faster, more informed decisions. Additionally, effective data visualization can foster collaboration across departments by providing a common understanding of the metrics that matter the most. As business environments become increasingly complex, mastering the art of data visualization will be a key factor in maintaining a competitive edge.