Understanding the Power of Data Visualization: Transforming Numbers into Insightful Stories
Data visualization is an essential technique that enables us to transform complex numbers into compelling narratives. By turning raw data into visual formats like charts, graphs, and infographics, we can uncover trends and patterns that may otherwise go unnoticed. This process not only enhances the clarity of the information but also engages the audience, making it easier for them to comprehend the underlying significance of the data. As the adage goes, 'a picture is worth a thousand words'; in the realm of data, this could not be more true.
Furthermore, understanding the power of data visualization allows businesses and analysts to make informed decisions rapidly. When data is presented visually, stakeholders can quickly grasp insights and implications, leading to faster strategic moves. Here are a few benefits of embracing data visualization:
- Increased comprehension of complex datasets
- Enhanced data retention
- Improved decision-making efficiency
By leveraging these visual tools effectively, organizations can not only communicate their findings but also inspire action and drive results.
The Process of Data Transformation: From Raw Data to Visual Masterpieces
The process of data transformation is a crucial step in turning **raw data** into insightful visual masterpieces. Initially, the journey begins with the collection of raw data, which can come from various sources such as databases, spreadsheets, or even real-time input from sensors. This raw data often requires significant cleaning and preprocessing, as it may contain inconsistencies, errors, or irrelevant information. During this stage, data analysts often employ techniques such as data cleansing, normalization, and standardization to enhance the quality of the data.
Once the data is prepared, the transformation process kicks into gear, which typically involves several key steps:
- Aggregation - Summarizing data points to derive meaningful metrics.
- Integration - Merging data from different sources to create a comprehensive dataset.
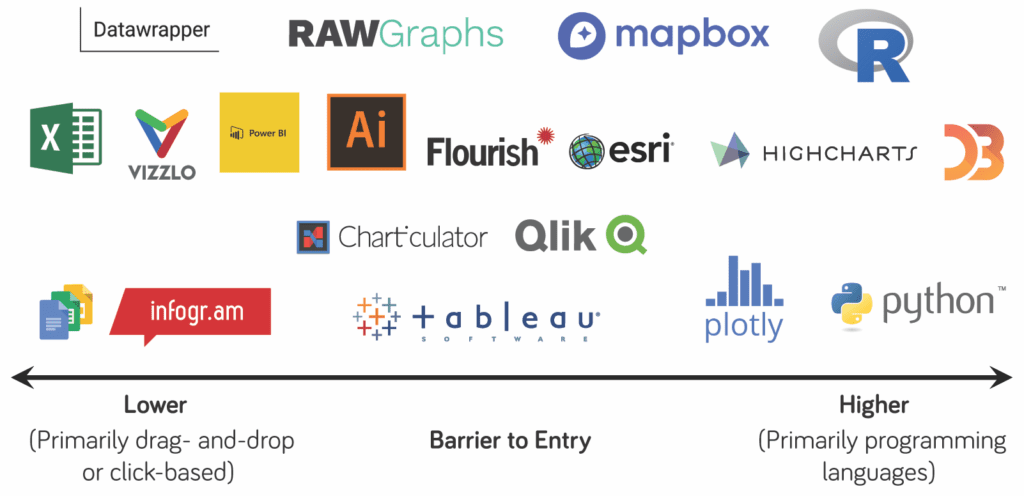
- Visualization - Using tools like graphs, charts, and dashboards to present the transformed data in an accessible way.
How to Choose the Right Visualization Techniques for Your Data Stories
Choosing the right visualization techniques for your data stories is essential for effective communication. First, consider your audience and the message you want to convey. Different techniques can highlight diverse aspects of your data. For instance, if you want to showcase trends over time, line charts might be most appropriate. Alternatively, if you need to compare quantities, bar charts could be more effective. In some cases, a combination of these techniques may even be the best approach to provide a holistic view of your data.
Another key factor in selecting visualization techniques is understanding your data's structure. Here are a few considerations to keep in mind:
- Data Type: Numerical data may require different visualizations than categorical data.
- Complexity: For datasets with many variables, using scatter plots or heat maps can make complex relationships clearer.
- Audience Engagement: Utilizing interactive visualizations can enhance user engagement and understanding.